Value Betting in Horse Racing: How to Identify Overlays and Build Long-Term Edge
Best Horse Racing Betting Sites – Bet on Horse Racing in 2026
Table of Contents
- Value Is the Only Edge a Punter Can Sustain — Here Is How to Measure It
- The Expected Value Formula: Your Core Profitability Test
- Building Your Own Tissue Prices Before the Market Opens
- Using the Overround to Measure Market Generosity
- Where Value Hides: Race Types, Field Sizes and Conditions That Create Overlays
- Tracking and Validating Your Value Judgements Over Time
- Value Betting vs Following Tips: Why Process Outweighs Prediction
- Frequently Asked Questions
Value Is the Only Edge a Punter Can Sustain — Here Is How to Measure It
Four years into my betting career I had a strike rate of 22% and felt genuinely good about my ability to pick winners. Then I ran the numbers on my actual profitability and discovered I was losing money — slowly, steadily, and invisibly. My selections were sound. My staking was disciplined. The problem was that I was backing horses at prices that did not reflect my edge. I was finding winners, but I was not finding value.
That realisation reframed everything. Picking winners and betting profitably are two different skills, and only the second one puts money in your pocket. A horse that wins at 2/1 when its true probability suggests it should be 6/4 is a bad bet — you won this time, but over hundreds of identical situations you would lose money. A horse that loses at 8/1 when its true probability suggests 5/1 is a good bet — you lost this time, but the price was in your favour, and over enough repetitions that edge compounds into profit.
Systematically backing favourites returns about 93p for every pound staked. That 7% loss is the market’s baseline tax on punters who do not assess value. Every percentage point you can claw back above that baseline comes from discipline: estimating true probabilities, comparing them to market prices, and only betting when the maths is in your favour. This article teaches you how to do exactly that.
The Expected Value Formula: Your Core Profitability Test
Expected value — EV — is the amount you expect to gain or lose per bet on average over a large number of identical bets. The formula is simple: EV = (probability of winning x profit if you win) minus (probability of losing x stake lost). If EV is positive, the bet makes money long-term. If negative, it does not. Every bet you place should pass this test before you commit your stake.
Let me work through an example with real numbers. You assess a horse at a 25% chance of winning. The bookmaker offers 5/1 (decimal 6.0). On a ten-pound stake, the profit if the horse wins is £50. The probability of losing is 75%. So: EV = (0.25 x £50) minus (0.75 x £10) = £12.50 minus £7.50 = +£5.00. Positive EV. For every ten pounds you stake in this situation, you expect to make five pounds on average. Not on every bet — on average, across many bets at similar value.
Now adjust the scenario. Same horse, same 25% probability, but the bookmaker offers 3/1 (decimal 4.0). Profit if winning: £30. EV = (0.25 x £30) minus (0.75 x £10) = £7.50 minus £7.50 = £0. Zero EV — a breakeven bet. At anything shorter than 3/1, this horse becomes a negative-EV proposition despite having a genuine one-in-four chance of winning.
The critical insight: value is not about the horse’s ability. It is about the relationship between the horse’s probability and the price on offer. A horse with a 10% chance of winning is a value bet at 12/1 and a terrible bet at 7/1, even though the horse is exactly the same animal in both cases. This is why I keep repeating that picking winners and finding value are different skills. You can be an excellent judge of horses and still lose money if you consistently accept prices that are too short.
For those who prefer a simpler test: divide 1 by the decimal odds to get the implied probability, then compare it with your estimated probability. If your estimate is higher than the implied probability, you have value. If it is lower, you do not. At horse racing odds explained I covered implied probability calculations in detail — the conversion between odds formats and probability is a prerequisite for everything in this article.
One caveat: EV calculations are only as good as your probability estimates. If you consistently overestimate your horses’ chances, every bet will appear to have positive EV but actually have negative EV. This is why tracking and calibration — which I cover later in this piece — are essential. The formula is mechanical; the judgment that feeds it is not.
Building Your Own Tissue Prices Before the Market Opens
The evening before a race, bookmakers publish their overnight prices — their initial assessment of each runner’s chances. Most punters treat these prices as the starting point for their own thinking, which means their analysis is anchored to the bookmaker’s view before they have done any independent work. I do the opposite. I build my own tissue — a set of probability estimates for every horse in the race — before I look at the market. Then I compare my tissue with the bookmaker’s prices and look for discrepancies.
Building a tissue is less complicated than it sounds. Start with your form analysis. You have already identified the likely contenders and assessed their claims based on class, distance, course, going, connections, and speed figures. Now assign each horse a percentage chance of winning. The percentages must add up to 100% — that is the discipline that forces you to make trade-offs. If you give the favourite a 35% chance, you cannot give the second favourite 30% and the third favourite 25% unless you are saying the rest of the field has only a 10% combined chance. The percentages constrain each other.
Favourites win roughly 30–35% of the time across UK racing. In fields of six, that figure climbs to around 40% at an average price just above even money. In fields of twelve, it drops to about 27% at roughly 2/1. These benchmarks help you calibrate. If you are routinely giving your top-rated horse a 50% chance in a twelve-runner handicap, your tissue is probably too concentrated — you are overestimating your ability to identify the winner in a competitive field.
Once the tissue is complete, convert each probability to decimal odds (divide 1 by the probability). Your 25% chance becomes 4.0 decimal, or 3/1. Compare that with the bookmaker’s price. If the bookmaker is offering 5/1 on a horse you rate at 3/1, the bookmaker thinks the horse is less likely to win than you do — that is a potential overlay. If the bookmaker offers 2/1 on the same horse, they think it is more likely than you do — no value.
I do not claim my tissues are perfectly accurate. They are my informed opinion, shaped by years of experience and a structured analytical process. But the act of pricing a race independently — before the market tells me what to think — is the single most powerful habit I have developed. It turns me from a price-taker into a price-maker, and that shift is where value betting begins.
Using the Overround to Measure Market Generosity
Not all races are equally hard to beat. The overround — the bookmaker’s built-in margin above 100% — varies significantly by race, and knowing where it sits before you bet tells you how steep the hill is.
Total remote betting gross gaming yield hit £2.6 billion in the 2024–25 financial year across all sports. Horse racing’s share of that was £766.7 million. Those numbers are the aggregate result of millions of individual bets, each one placed against a market that systematically favours the house via the overround. Your job as a value bettor is to find the specific situations where the overround is lowest — where the market is closest to “fair” — and concentrate your action there.
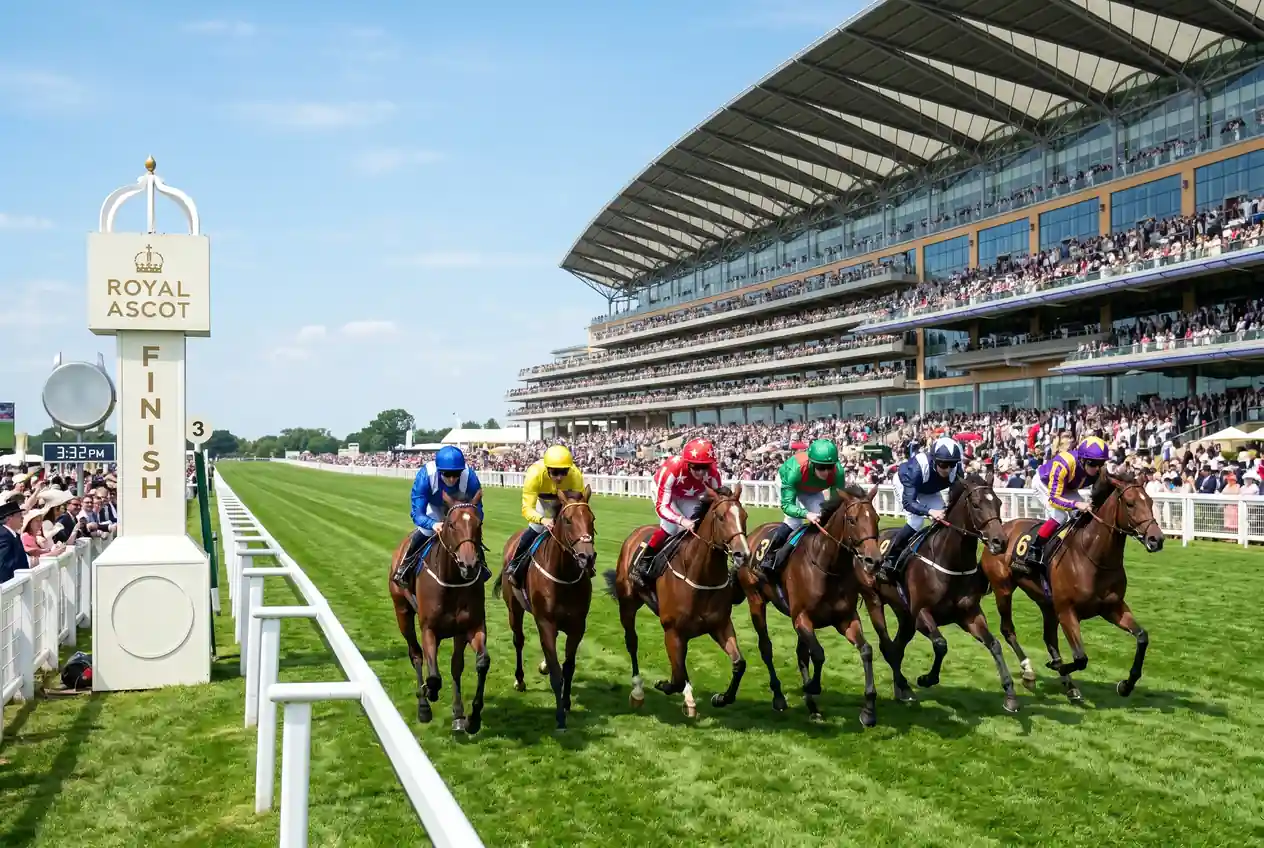
High-profile races carry lower overrounds because they attract the most money and the most informed bettors. A Group 1 at Royal Ascot might have a book percentage of 108–112%. A six-runner evening meeting at a minor track might be 120–130%. The higher the overround, the more edge you need in your probability estimates just to break even. At 130%, roughly 23% of the theoretical payout is absorbed by the bookmaker’s margin before you even start.
Exchange markets run tighter again — often 101–103% — because there is no bookmaker margin, only a small commission on winning bets. If your value analysis identifies an overlay, the exchange is frequently the place to capture the best price, provided there is enough liquidity on the horse you want to back. For smaller races, liquidity can be thin, and the bookmaker price might actually be better despite the higher overround.
I calculate the overround for every race I consider betting on. It takes thirty seconds — sum the implied probabilities of all runners — and it tells me whether the race is worth the effort. A race with a 125% book needs a stronger conviction bet than a race with a 110% book. Factoring the overround into your decision is not optional; it is the difference between thinking about value in theory and measuring it in practice.
Where Value Hides: Race Types, Field Sizes and Conditions That Create Overlays
After nine years of tracking where my profitable bets cluster, the patterns are clear. Value does not appear randomly across the racing calendar. It concentrates in specific types of races, at specific points in the season, and under specific conditions. If you know where to look, you spend less time searching and more time capitalising.
Large-field handicaps are the richest hunting ground. In fields of twelve or more, the favourite wins only about 27% of the time, which means the market is wrong nearly three out of four races. More importantly, the complexity of handicapping — where every horse carries a different weight based on its official rating — creates pricing inefficiencies. The market often overvalues the obvious form horse and undervalues class droppers, horses returning from absence with an unexposed profile, or horses whose going preferences are not fully factored into the price.
Richard Wayman of the BHA noted that while turnover was declining, improvements in gross win suggested that racecourse results were not favouring punters — and simultaneously, the number of recreational bettors was growing. More recreational money entering the market means more volume based on superficial factors: name recognition, jockey fame, recent winners. That money pushes prices out of line with true probabilities, and it creates value for punters doing deeper analysis.
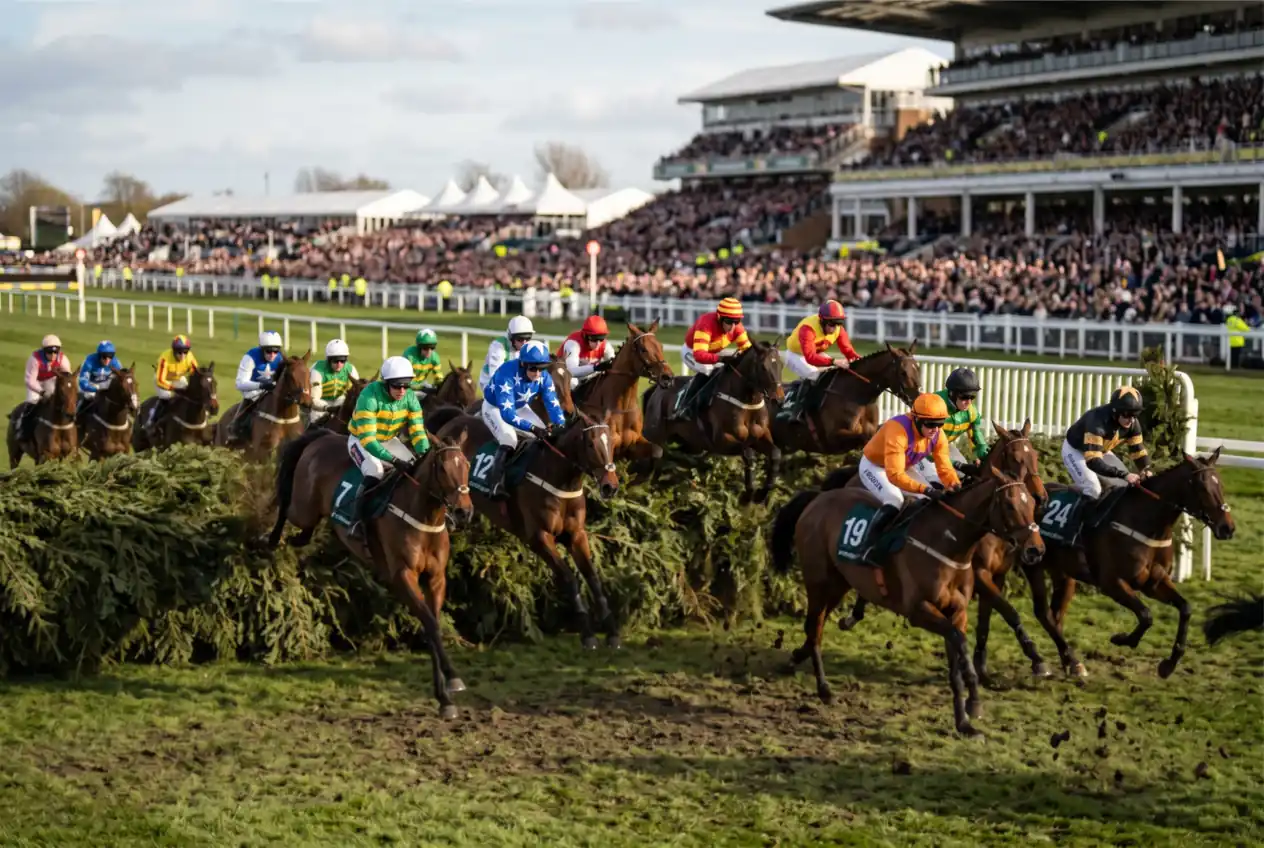
Seasonal transitions are another overlay zone. At the start of the Flat season in April, two-year-old debutants appear with zero form. The market prices them on pedigree, trainer reputation, and whispers from the gallops. These are inherently uncertain assessments, and uncertainty creates wider price distributions — more room for an overlay or an underlay in every race. Similarly, the start of the National Hunt season in autumn brings horses returning from summer breaks with changed fitness and sometimes changed trainers, and the market takes several runs to recalibrate.
Turnover on Core Fixtures fell 8.6% against 2024 while Premier Fixtures rose 2.7%. That split tells you something about where the smart money goes — and where it does not. Lower-profile meetings with less informed money in the market are mathematically more likely to produce mispricings. A Tuesday card at Catterick or Plumpton might not be glamorous, but the market there is thinner, the form analysis less rigorous, and the opportunities for a prepared punter more frequent than at a Saturday meeting where every angle has been dissected by the Racing Post, a dozen tipsters, and thousands of informed punters.
Ground conditions create a different category of overlay. When going changes on the day — rain softening the ground, or a dry spell firming it up — the market adjusts, but often too slowly. If you have already identified horses whose form on the new going is significantly better than the market has priced in, you can capture value before the price moves. This is not about predicting the weather; it is about being prepared for the impact of a weather change that has already happened. Having a pre-made list of going specialists among the day’s runners is one of the simplest overlay-generating habits I have developed.
Tracking and Validating Your Value Judgements Over Time
Claiming you found a value bet is easy. Proving it is hard — and the proof lives in your long-term records, not in any individual result. A horse that you rated at 25% and backed at 5/1 might lose. It probably will lose — 75% of the time, by your own estimate. The single result tells you nothing about whether the bet was sound. Only the pattern across hundreds of similar bets reveals whether your value judgements are genuinely profitable.
I track every bet with a field I call “estimated probability.” After the race, I record whether the horse won or lost. Over time, I group bets by probability bands — say, all horses I estimated at 20–30% — and check the actual win rate against the midpoint estimate. If I estimated 25% and the actual win rate across 100 such bets is 28%, my estimates in that band are slightly conservative, which means I am finding value. If the actual win rate is 18%, I am overestimating, and what I thought was value was actually negative EV.
This calibration exercise is humbling. My first year of tracking revealed that I was systematically overestimating horses in the 10–15% probability range — longshots. I rated them at 12% on average, but they were winning at about 8%. The bets looked like value at the time, but the gap between my estimate and reality meant I was losing money on that segment. I adjusted by being more conservative at longer prices, and the segment moved towards breakeven.
Confidence calibration is a separate but related skill. When you rate a horse at 25%, how certain are you of that 25%? You might feel strongly about the assessment — this is a horse with clear form advantages — or you might feel uncertain. I flag each bet as “high confidence” or “standard confidence” and review the two groups separately. Over three years of data, my high-confidence bets have outperformed standard ones by roughly four percentage points of ROI. That difference is large enough to influence staking: I stake slightly more on high-confidence value bets, within the constraints of my staking plan.
A sample of at least 200 bets per probability band is needed for reliable calibration. That takes time — months or even a year depending on your volume. But the data accumulates, and each quarterly review sharpens your estimates. The punters who track and calibrate improve. The punters who do not are flying blind, convinced they are finding value because the maths on individual bets looks right, without ever checking whether the maths holds up across the sample that actually determines profit and loss.
Value Betting vs Following Tips: Why Process Outweighs Prediction
Tipping services sell predictions. Value betting is a process. The difference matters more than most punters realise, because a prediction is only useful if the price is right — and tipping services rarely tell you what price to take.
Consider a tipster who selects a horse at 8/1 in the morning. By the time you see the tip, place your bet, and the market adjusts for all the other followers, the price might be 5/1. The tipster’s selection might have been a value bet at 8/1, but at 5/1 the value has evaporated. You are backing the same horse, but at a price that no longer compensates for the risk. The baseline return for undiscriminating favourite backers is negative — about seven pence lost per pound wagered. Following a tipster at prices that have already shortened can produce similar or worse returns, because the tip tax is real.
Value betting sidesteps this problem because the process starts with your own probability estimate and compares it to the available price at the moment you are ready to bet. There is no lag, no tip tax, no reliance on someone else’s timing. If the price offers value, you bet. If it does not, you pass. The decision is entirely yours and entirely current.
That said, I am not dismissive of tipsters entirely. A good tipster with a transparent, long-term record of profit can be a useful data point — not a substitute for your own analysis, but a second opinion. If a tipster whose strike rate and ROI I respect selects a horse that I have independently shortlisted, that convergence increases my confidence. If they select a horse I have dismissed, I re-examine my reasoning. But I never bet solely on a tip without running it through my own process, and neither should you. The process is the edge. The tip is just information.
Frequently Asked Questions
What is a realistic edge percentage for a skilled value bettor in horse racing?
Most consistently profitable punters operate with an edge of 3-8% over the market. That means for every pound staked, the expected return is roughly 1.03 to 1.08 pounds. It does not sound dramatic, but compounded across hundreds or thousands of bets per year, even a 5% edge produces meaningful profit. Anything above 10% sustained over a large sample is exceptional.
How do I estimate a horse’s true win probability before the race?
Start with form analysis — class, distance, course, going preferences, connections, and speed figures. Assign each horse in the race a percentage chance of winning, ensuring the total adds up to 100%. Use historical base rates as a guide: favourites win 30-35% overall, about 40% in small fields, about 27% in large fields. Compare your estimates with the bookmaker’s implied probabilities to identify overlays.
Can value betting work if I only bet at weekends?
Yes, weekend-only betting is viable and arguably suits value betting well. Saturday cards at the major UK tracks attract the biggest fields, the most competitive handicaps, and the most liquid markets — all conditions that create pricing inefficiencies. You will place fewer bets, which means a longer timeline to reach a statistically meaningful sample, but the quality of opportunities per session is typically higher than on a quiet Tuesday card.
How many bets do I need to make before I can trust my value-betting results?
At least 500 bets of the same type for a reliable assessment, and ideally 1,000 or more. Fewer than 200 bets tells you almost nothing — variance dominates at small samples. If you are placing three to five bets per week, reaching 500 takes roughly two to three years. Patience with the data is as important as patience with the losing runs.
Created by the ”Tips for Horse Racing Betting” editorial team.