Speed Figures in Horse Racing: How Time-Based Ratings Reveal True Ability
Best Horse Racing Betting Sites – Bet on Horse Racing in 2026
 Available in US
Table of Contents
- Speed Figures Strip Away Subjectivity and Let the Clock Decide
- How Speed Figures Are Calculated: Standard Time, Going Allowance and Weight
- RPR vs Topspeed vs Sectional Times: Comparing the UK’s Main Rating Systems
- Recommended online casinos
- Using Speed Figures in Practice: Setting a Par and Filtering the Field
- Limitations: When Speed Figures Mislead
Speed Figures Strip Away Subjectivity and Let the Clock Decide
I used to argue with a friend about horses the way people argue about football. “He looked good winning at Newbury.” “Yeah, but the pace was slow and the second horse was useless.” Back and forth, opinion against opinion, neither of us with a way to settle it. Then I started using speed figures, and those arguments evaporated. When Betfair’s data showed over a million price signals across 73 exchange markets for a single set of races, the sheer volume of information flowing through the market was staggering — but speed figures cut through that noise by answering a simpler question: how fast did the horse actually run, adjusted for conditions?
Speed figures are not a crystal ball. They do not tell you who will win tomorrow. But they are the closest thing racing has to an objective performance metric, and in a sport dominated by subjective assessments, objectivity is worth its weight in gold.
How Speed Figures Are Calculated: Standard Time, Going Allowance and Weight
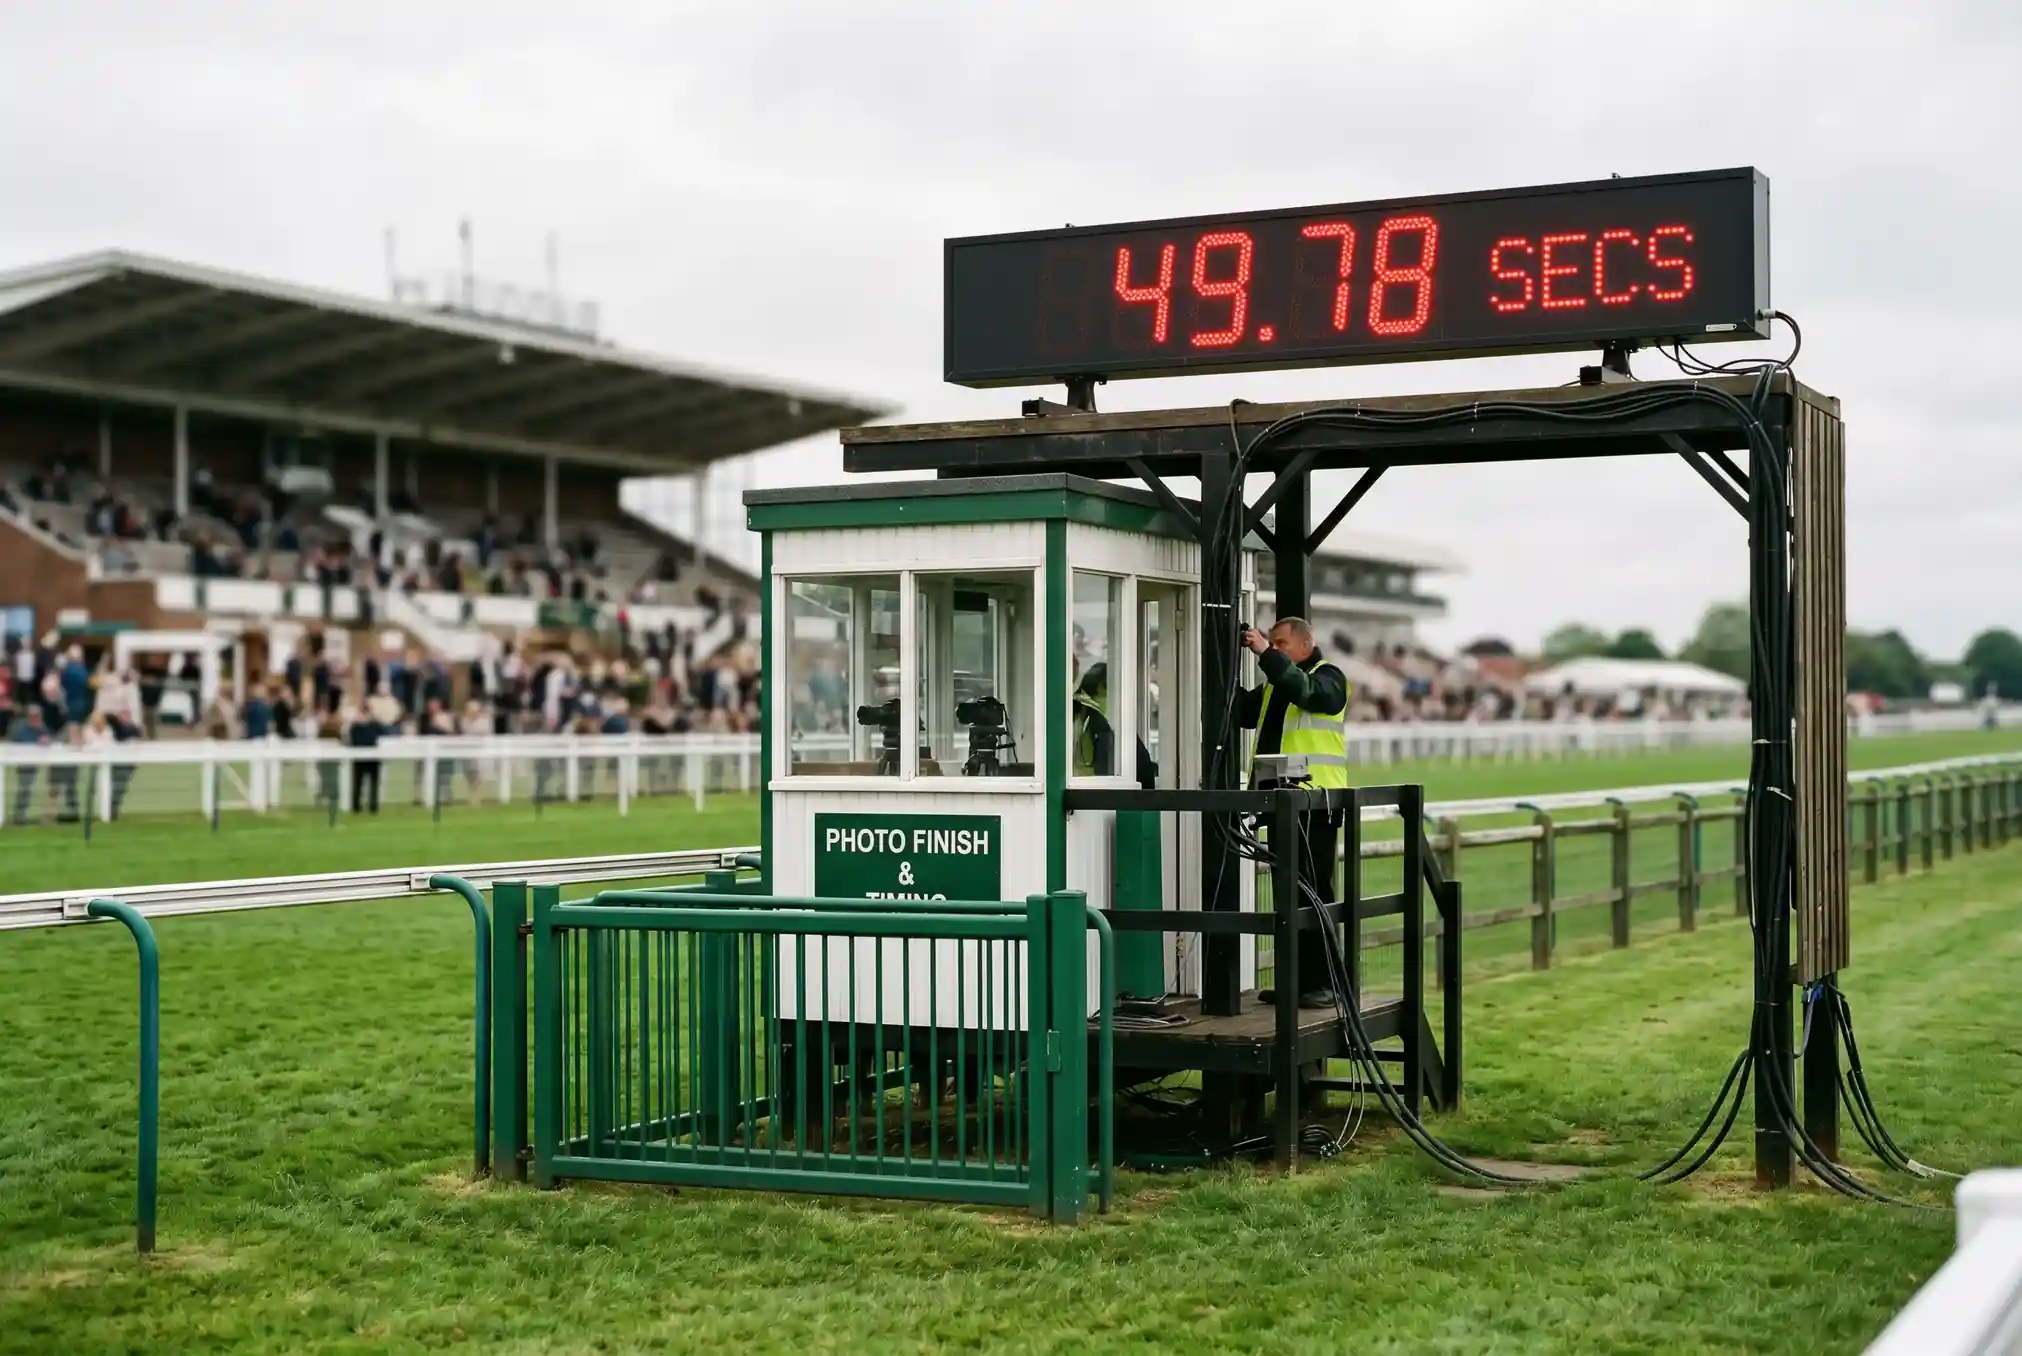
Every race has a “standard time” — the expected time for that course and distance on good ground. Speed figures start by comparing the actual race time against that standard. If a horse runs a mile at Newmarket in 1 minute 36 seconds and the standard time is 1 minute 38 seconds, the race was run two seconds faster than standard.
That raw time difference is then adjusted for the going. Soft ground slows races by several seconds per mile, so a horse running two seconds faster than standard on soft ground has achieved something significantly more impressive than one running two seconds fast on firm. The going allowance translates the conditions into a standard baseline, ensuring horses racing on different ground can be compared like for like.
Weight adjustments follow. A horse carrying 10 stone and running a mile in 1:36 is performing at a different level than one carrying 9 stone and posting the same time. The weight adjustment typically uses an industry-standard scale: roughly one pound equals one length, and one length equals about 0.2 seconds over a mile. These adjustments are approximations, but they are good enough to create useful comparisons across different races, courses and conditions.
The final figure is expressed as a number — higher is better. A speed figure of 95 means the horse ran at the level typically associated with a competitive Class 3 handicapper on the flat. A figure of 110 puts it in Group-race territory. A figure of 75 is moderate. The scale is relative, which means the figures are most useful when comparing horses against each other within the same race or across recent races at a similar level.
RPR vs Topspeed vs Sectional Times: Comparing the UK’s Main Rating Systems
The Racing Post Rating (RPR) is the most widely used figure in UK racing. It combines time-based data with an assessment of the quality of the race — a horse does not need to run a fast time to earn a high RPR if it wins a strong race by a wide margin. RPR is partially subjective: the race-reader’s assessment of how the race was run influences the final number. That makes it useful but not purely objective.
Topspeed, published by Timeform, is a purer speed figure. It relies more heavily on raw time data and going adjustments, with less race-reading input. Researchers studying exchange market efficiency noted that informational efficiency in returns is remarkably high, and Topspeed attempts to capture that efficiency by measuring performance rather than interpreting it. Some punters prefer Topspeed precisely because it removes the human element — the figure tells you what happened on the clock, not what the analyst thinks happened.
Sectional times are the newest addition to UK racing data. Instead of measuring the overall race time, sectionals break the race into segments — the first two furlongs, the middle section, the final two furlongs. This reveals how a race was run in a way that overall times cannot. A horse that clocked a slow overall time but a blistering final two furlongs is a closer with more ability than the headline figure suggests. A horse that ran a fast overall time but decelerated sharply in the final furlong may have been flattered by an unsustainable early pace.
For most punters, RPR is the practical starting point because it is freely available on racecards. Add Topspeed when you want a second opinion, and use sectional times when they are available to dig into how a horse achieved its figure. The three systems complement each other, and disagreements between them often highlight horses whose ability is being under- or over-estimated by the market.
Recommended online casinos
- BeOnBetBonus: 100% up to €500 + 100 FS · Payout speed: 1-3 business days
- Revery PlayBonus: 100% up to€1,000+ 100 FS · Payout speed: 1-3 business days
- ChanzeBonus: Slots Welcome Bonus #1 200% up to €500 · Payout speed: 1-3 business days
- JetsetspinsBonus: 200% Bonus + 100 Free Spins + Free Royal Wheel · Payout speed: 1-3 business days
- DieselwinBonus: Welcome Pack 250% up to £4000 + 200 FS · Payout speed: 1-3 business days
- ZombillionBonus: Welcome Pack 250% up to £4000 + 200 FS · Payout speed: 1-3 business days
- WinBeastBonus: €5000 + 500 FS + €650 Freebet · Payout speed: 1-3 business days
- NightWinBonus: £900 + 400 free spins · Payout speed: 1-3 business days
- SpinFormulaBonus: 550% Up To £15,000 + 550 FS · Payout speed: 1-3 business days
Using Speed Figures in Practice: Setting a Par and Filtering the Field
The practical application of speed figures is straightforward: set a “par” for the race and filter out horses that have not reached it. The par is the typical winning speed figure for a race of this class, distance and going. In a Class 4 handicap over a mile on good ground, the winning figure is usually between 80 and 90. Any horse in the field that has never posted a figure above 75 is statistically unlikely to win. Any horse that has posted a 95 is potentially well treated.
I use a simple three-step process. First, check the highest speed figure each horse has achieved in its last five runs. Second, compare those figures against the par for today’s race. Third, shortlist horses whose best recent figure meets or exceeds the par and whose most recent run was not dramatically below it (a drop of 10 points or more from peak suggests something has gone wrong). In fields of six runners, where public favourites win roughly 40% of the time, the speed figure filter usually confirms the favourite’s status but occasionally highlights a second or third horse that the market has undervalued.
Connecting speed figures to a broader value assessment transforms them from a screening tool into a pricing tool. If the speed figures suggest Horse A and Horse B are separated by two points (effectively one length), but the market prices Horse A at 2/1 and Horse B at 8/1, the market is saying the form gap is much wider than the figures indicate. That discrepancy is a starting point for a value bet — not a guarantee, but a flag that warrants further investigation.
Limitations: When Speed Figures Mislead
Speed figures are a tool, not an answer. They mislead most often when the going changes during a race. If the official going is “good” but a shower of rain turns the final two furlongs soft, the overall time will be slower than the going suggests, and the speed figure will understate the horse’s ability. Sectional times help here, but they are not available for every race.
Flat sprints over five furlongs are another area where speed figures can be unreliable. The margin for error in timing is proportionally larger over shorter distances, and a false start, a stumble from the stalls or interference in the first furlong can distort the time without reflecting the horse’s actual ability. Over longer distances (a mile and a half or more), the larger sample of strides smooths out individual incidents and produces more reliable figures.
Finally, speed figures tell you about the past, not the future. A horse that posted a 95 three runs ago and has since run 80 and 78 is declining, and the 95 is no longer a reliable guide. Always weight recent figures more heavily than career bests, and treat any figure older than six months with caution — fitness, age and training changes can all alter a horse’s performance level between seasons.
Are Racing Post Ratings (RPR) the same as official BHA ratings?
No. RPR is produced independently by the Racing Post and combines time data with race-reading analysis. The BHA official rating (OR) is assigned by the BHA’s team of handicappers and is used to determine the weights horses carry in handicap races. The two figures often correlate but can differ significantly, especially for horses the handicapper believes have not yet shown their full ability.
How do sectional times improve on traditional speed figures?
Sectional times break a race into segments, revealing how the pace unfolded. A horse with a slow overall time but a fast final section is finishing strongly and may be better than the headline figure suggests. Traditional speed figures only measure the total race time, which can be distorted by the early pace. Sectionals give you a more detailed picture of how each horse ran its race.
Can I create my own basic speed ratings from publicly available data?
Yes, at a basic level. You need the official race time, the standard time for the course and distance (available from course websites), and a going adjustment. Subtract the standard time from the actual time, apply a rough going allowance (add time for soft ground, subtract for firm) and you have a crude speed figure. The result will not match professional ratings — which use more sophisticated adjustments — but it gives you a useful comparative tool for filtering fields.
The full picture is in our data-driven guide to horse racing betting.
Where the figures sit in the form: the form guide.
Created by the ”Tips for Horse Racing Betting” editorial team.