Draw Bias in Flat Racing: Where the Advantage Actually Sits
Best Horse Racing Betting Sites – Bet on Horse Racing in 2026
 Available in US
Table of Contents
- On Some UK Tracks the Stall Draw Decides the Race Before It Starts
- Recommended online casinos
- Why Stall Position Creates an Advantage on Certain Courses
- Key UK Courses with Proven Draw Bias: Chester, Beverley, Musselburgh and More
- How Ground Conditions Amplify or Neutralise Draw Bias
- Incorporating Draw Data into Your Pre-Race Analysis
On Some UK Tracks the Stall Draw Decides the Race Before It Starts
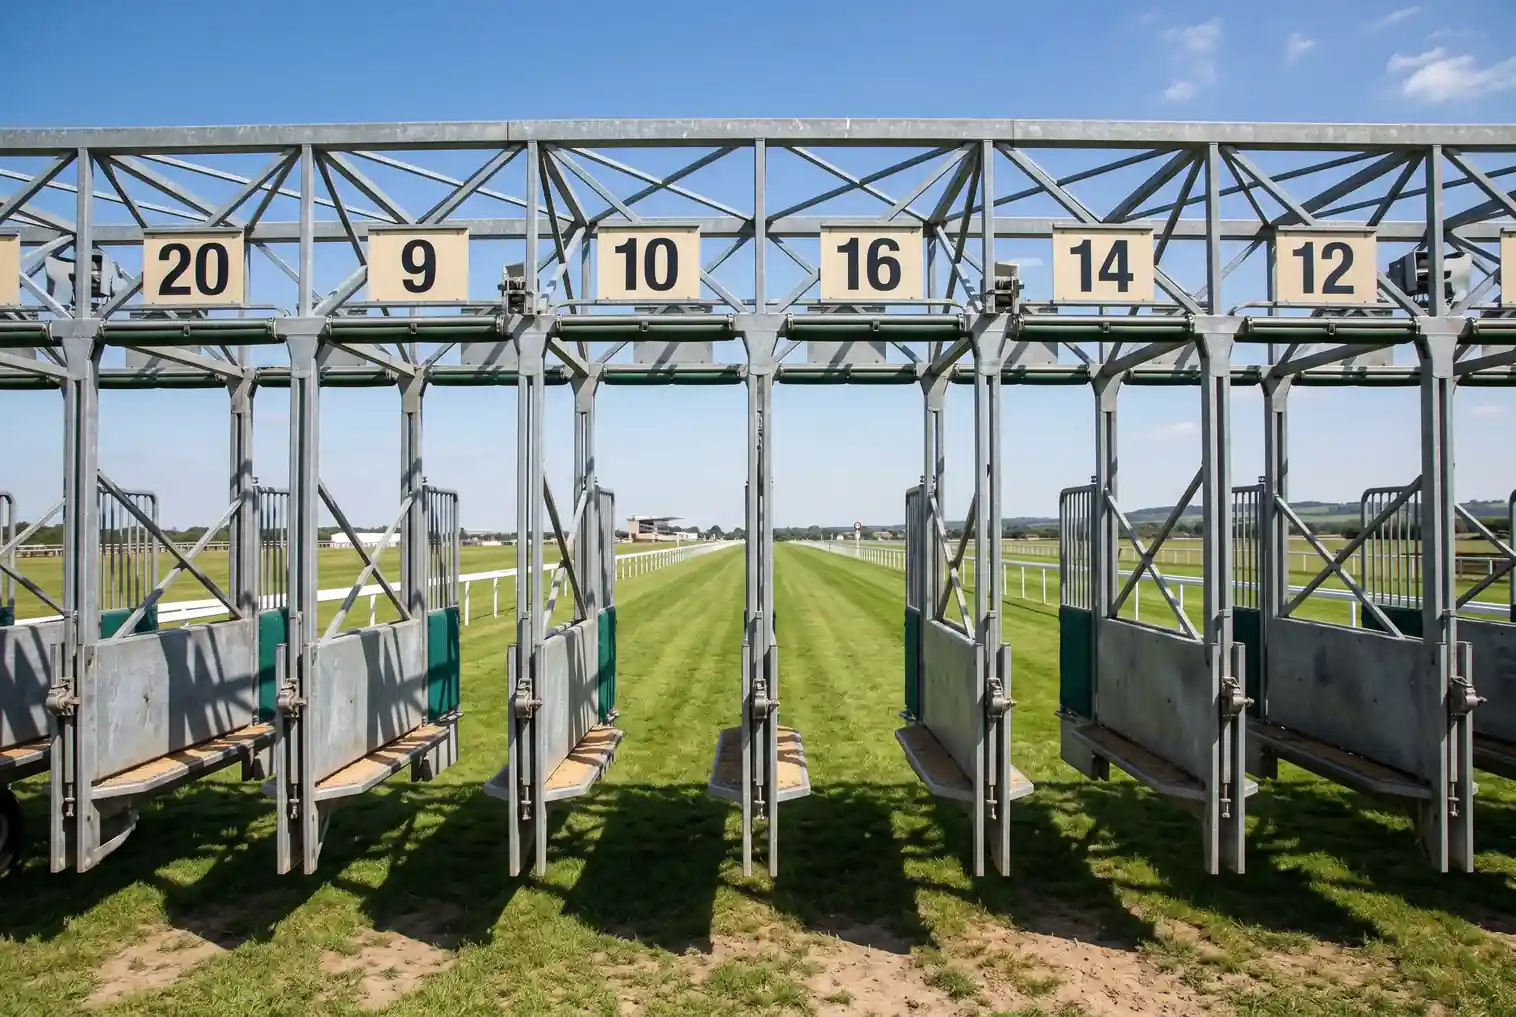
Chester, May meeting, a seven-furlong handicap with 12 runners. I had narrowed the field to three horses on form, but one of them was drawn in stall 11. At Chester, that is practically a death sentence over seven furlongs. The tight left-handed circuit gives a massive advantage to low-drawn horses who can grab the rail from the start, while wide draws burn energy compensating for the extra ground covered on every turn. I struck through stall 11, bet the other two, and the winner came from stall 2. Draw bias is not a theory at Chester — it is a fact you either respect or lose money ignoring.
Not every course has meaningful draw bias, and not every race at a biased course is affected equally. But on courses where the geometry creates a genuine advantage for certain stall positions, draw data becomes a filter as important as form, going preference or class.
Recommended online casinos
- BeOnBetBonus: 100% up to €500 + 100 FS · Payout speed: 1-3 business days
- Revery PlayBonus: 100% up to€1,000+ 100 FS · Payout speed: 1-3 business days
- ChanzeBonus: Slots Welcome Bonus #1 200% up to €500 · Payout speed: 1-3 business days
- JetsetspinsBonus: 200% Bonus + 100 Free Spins + Free Royal Wheel · Payout speed: 1-3 business days
- DieselwinBonus: Welcome Pack 250% up to £4000 + 200 FS · Payout speed: 1-3 business days
- ZombillionBonus: Welcome Pack 250% up to £4000 + 200 FS · Payout speed: 1-3 business days
- WinBeastBonus: €5000 + 500 FS + €650 Freebet · Payout speed: 1-3 business days
- NightWinBonus: £900 + 400 free spins · Payout speed: 1-3 business days
- SpinFormulaBonus: 550% Up To £15,000 + 550 FS · Payout speed: 1-3 business days
Why Stall Position Creates an Advantage on Certain Courses
Track layout is the root cause of draw bias. Courses where the starting point is close to a bend give inside-drawn horses a shorter route to the rail. Courses with straight tracks can show bias towards one side if the ground wears unevenly or if there is a camber. Courses with long run-ins after the final bend tend to neutralise draw bias because horses have time to reposition.
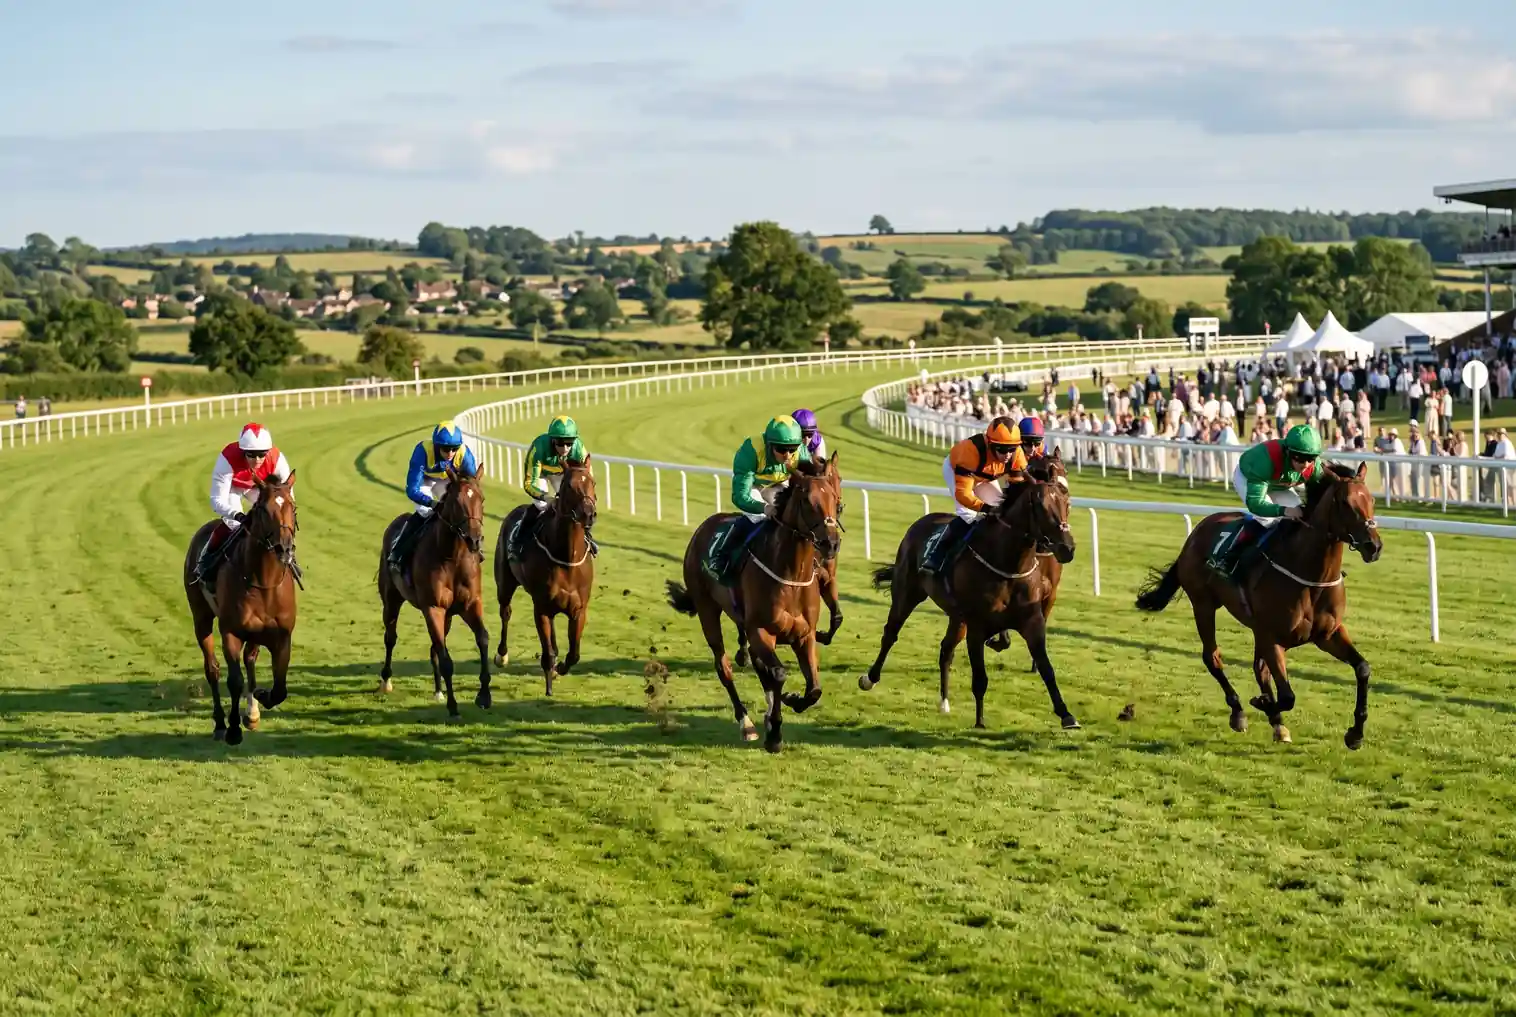
Distance matters. In sprints (five and six furlongs), draw bias is often strongest because there is less time and distance for horses to recover from a poor position. Over a mile or more, the additional time allows jockeys to manoeuvre, and the draw becomes less deterministic. That said, on extremely tight courses like Chester, the draw influences races up to a mile and a half because the bends are so tight that the inside rail advantage persists throughout.
Field size amplifies the effect. In a five-runner race, all horses are drawn close together and the positional difference between stall 1 and stall 5 is marginal. In a 16-runner sprint, the horse in stall 16 is a significant distance from the rail, and the wider the draw, the more ground that horse must cover to reach a competitive position. In fields of six runners, public favourites win roughly 40% of the time, partly because fewer runners reduce the positional lottery. In fields of 12 or more, the draw becomes a genuine variable.
Key UK Courses with Proven Draw Bias: Chester, Beverley, Musselburgh and More
Chester is the most extreme example of draw bias in the UK. Over five and six furlongs, low draws (stalls 1-4) have a win rate approximately 40-50% higher than high draws (stalls 9+) over the past decade. The Roodee is barely a mile round, with an exceptionally tight left-handed bend that dogs the circuit. Any horse drawn wide has to cover extra ground on every single turn, and at sprint distances, that deficit is almost impossible to recover.
Beverley is a right-handed track where high draws tend to have an advantage over five furlongs. The course has a pronounced uphill finish and a camber that pushes horses towards the far rail, meaning high-drawn runners can take the most economical route while low draws drift towards the stands rail and lose ground. The bias is not as dramatic as Chester, but it is consistent enough to filter your selections.
Musselburgh shows a clear low-draw advantage over five and seven furlongs. The right-handed course has tight bends and a short straight, which means low-drawn horses hug the rail into the home turn while high draws swing wide. Nottingham, Carlisle and Thirsk also show periodic draw bias, though it tends to be more condition-dependent — stronger on soft ground when one side of the track rides differently from the other.
Ascot’s straight course (five furlongs, six furlongs and a mile) does not have a consistent draw bias in normal conditions. However, when the stalls are placed on one side of the track and the going is softer on one rail than the other, a temporary bias can emerge. This is situational rather than structural and requires checking the specific day’s conditions rather than relying on historical averages. About 80% of UK races are won by the top 20% of trainers and jockeys, and these professionals are acutely aware of draw patterns — when you see a top yard request a specific stall position, pay attention.
How Ground Conditions Amplify or Neutralise Draw Bias
Soft ground makes draw bias worse. When the going is testing, the inside rail — which receives more foot traffic from earlier races — cuts up faster, and the advantage shifts from the low draw to whichever part of the track still has intact ground. At some courses, this means the middle of the track becomes the favoured strip, and neither extreme low nor extreme high draws benefit.
At Chester, soft ground amplifies the low-draw advantage further because the tight bends become even more punishing when horses are slipping on a yielding surface. At Beverley, heavy rain can neutralise the high-draw advantage because the camber effect is lessened when the entire track is uniformly soft. Favourites generally win at a slightly lower rate on soft and heavy ground, and draw bias is one of the contributing factors — the market does not always fully price in the interaction between ground and stall position.
Watering regimes also play a role. Courses that water selectively to produce even ground across the track reduce draw bias. Courses that water uniformly may still see bias if the underlying drainage differs from one side to the other. Checking the clerk of the course’s watering report, often published the day before racing, can give you a clue about whether the draw is likely to matter on a specific day.
Incorporating Draw Data into Your Pre-Race Analysis
I treat draw bias as a filter, not a selection method. A horse with perfect form, the right going and a top jockey but a poor draw gets downgraded — it does not get eliminated outright unless the bias is extreme (Chester over five furlongs from stall 12 in a 14-runner race is as close to elimination as I get). A horse with good but not outstanding form that has drawn perfectly gets a small upgrade. The draw adjusts the probability, it does not replace the analysis.
Build a simple reference table. For each course where you regularly bet, note the favoured draw positions by distance and going. Chester low over five to seven furlongs, Beverley high over five furlongs, Musselburgh low over five to seven furlongs. Update it annually — bias patterns can shift if the course layout is altered or if drainage work changes the ground characteristics. Connecting this draw data to your broader form analysis turns it from trivia into actionable edge.
The biggest trap is overweighting the draw. On courses with no proven bias, or in races over distances where jockeys have time to reposition, the draw is noise. Waste time factoring in stall position at Newmarket over a mile and a half and you are optimising for a variable that has minimal impact. Focus your draw analysis on the courses and distances where the data shows a genuine, repeatable effect, and ignore it everywhere else.
Does draw bias apply to National Hunt racing?
Generally no. National Hunt races start from a tape rather than stalls, and the longer distances (two miles minimum) give jockeys ample time to find their preferred position regardless of where they line up. There can be very minor positional advantages at tight courses, but nothing comparable to the stall draw bias seen in flat sprints.
Where can I find reliable draw statistics for UK racecourses?
Racing Post publishes course-specific draw data in its course guides, broken down by distance and going. Timeform and Proform also offer detailed draw statistics. For free data, several racing forums compile annual draw tables. The key is to use data covering at least three years to ensure the patterns are genuine rather than short-term anomalies.
How much should draw bias influence my selection in a big-field sprint?
On a course with proven bias like Chester over five furlongs, draw should be a primary filter — eliminate horses in the worst draw positions before assessing form. On courses with moderate bias, downgrade poorly drawn horses by one or two positions in your shortlist. On courses with no proven bias, ignore it entirely and focus on form, going and class.
The full picture is in our data-driven guide to horse racing betting.
Where the Flat season runs: the month-by-month guide.
Created by the ”Tips for Horse Racing Betting” editorial team.